Statistics for the Plotted Points
TRICLOSAN
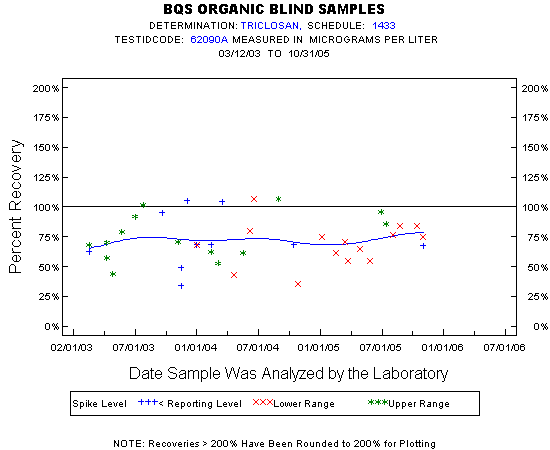
Spike Level
N
Mean
Std-Dev.
Median
F_Pseudo
Lower Range
15
69%
18%
71%
19%
Upper Range
14
75%
19%
71%
23%
< Reporting Level
10
72%
23%
68%
24%
Total
39
72%
19%
69%
17%
Miscellaneous Statistics for the Samples
TRICLOSAN
Characteristic
N
%
% Basis
Plotted
39
100%
Spiked
Estimated Values
17
44%
Spiked
Deleted Values
1
1%
Spiked + Not Spiked
Spiked, Censored
0
0%
Spiked
Spiked
39
.
False Negatives
0
0%
0 out of 39
Not Spiked
84
.
False Positives
0
0%
0 out of 83