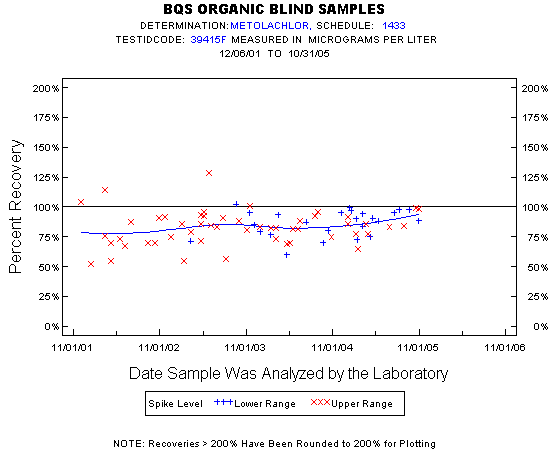
Statistics for the Plotted Points
METOLACHLOR
Spike Level
N
Mean
Std-Dev.
Median
F_Pseudo
Lower Range
25
87%
11%
89%
12%
Upper Range
53
83%
14%
83%
13%
Total
78
84%
13%
84%
13%
Miscellaneous Statistics for the Samples
METOLACHLOR
Characteristic
N
%
% Basis
Plotted
78
99%
Spiked
Estimated Values
3
4%
Spiked
Deleted Values
1
1%
Spiked + Not Spiked
Spiked, Censored
0
0%
Spiked
Spiked
80
.
False Negatives
1
1%
1 out of 79
Not Spiked
43
.
False Positives
0
0%
0 out of 43