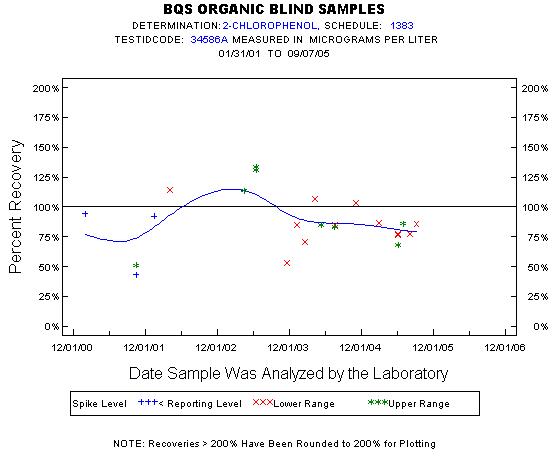
Statistics for the Plotted Points
2-CHLOROPHENOL
Spike Level
N
Mean
Std-Dev.
Median
F_Pseudo
Lower Range
12
85%
17%
85%
13%
Upper Range
8
94%
29%
86%
34%
< Reporting Level
3
77%
29%
92%
38%
Total
23
87%
23%
85%
19%
Miscellaneous Statistics for the Samples
2-CHLOROPHENOL
Characteristic
N
%
% Basis
Plotted
23
100%
Spiked
Estimated Values
5
22%
Spiked
Deleted Values
1
2%
Spiked + Not Spiked
Spiked, Censored
0
0%
Spiked
Spiked
24
.
False Negatives
0
0%
0 out of 23
Not Spiked
32
.
False Positives
0
0%
0 out of 32