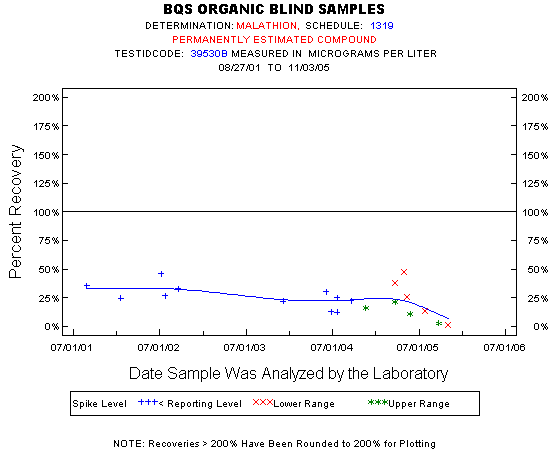
Statistics for the Plotted Points
MALATHION
Spike Level
N
Mean
Std-Dev.
Median
F_Pseudo
Lower Range
5
25%
19%
25%
18%
Upper Range
4
13%
8%
14%
9%
< Reporting Level
11
26%
10%
25%
8%
Total
20
23%
13%
23%
14%
Miscellaneous Statistics for the Samples
MALATHION
Characteristic
N
%
% Basis
Plotted
20
34%
Spiked
Estimated Values
20
34%
Spiked
Deleted Values
2
3%
Spiked + Not Spiked
Spiked, Censored
31
53%
Spiked
Spiked
60
.
False Negatives
7
12%
7 out of 58
Not Spiked
6
.
False Positives
0
0%
0 out of 6