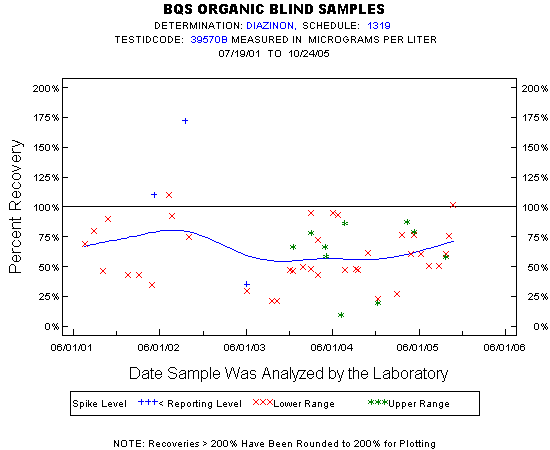
Statistics for the Plotted Points
DIAZINON
Spike Level
N
Mean
Std-Dev.
Median
F_Pseudo
Lower Range
37
60%
24%
51%
22%
Upper Range
10
61%
27%
67%
15%
< Reporting Level
3
106%
69%
110%
102%
Total
50
63%
29%
61%
24%
Miscellaneous Statistics for the Samples
DIAZINON
Characteristic
N
%
% Basis
Plotted
50
100%
Spiked
Estimated Values
28
56%
Spiked
Deleted Values
1
2%
Spiked + Not Spiked
Spiked, Censored
0
0%
Spiked
Spiked
51
.
False Negatives
0
0%
0 out of 50
Not Spiked
15
.
False Positives
0
0%
0 out of 15