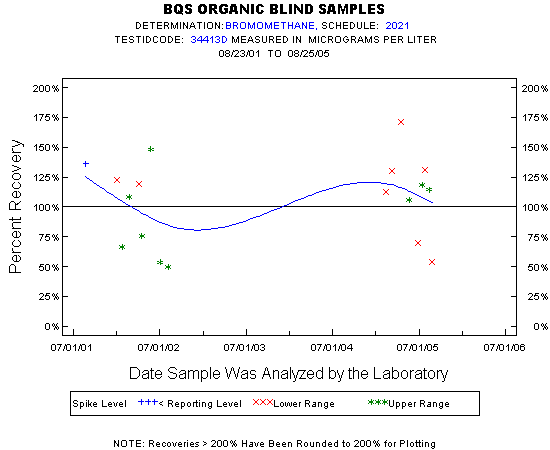
Statistics for the Plotted Points
BROMOMETHANE
Spike Level
N
Mean
Std-Dev.
Median
F_Pseudo
Lower Range
8
114%
37%
121%
29%
Upper Range
9
94%
34%
106%
36%
< Reporting Level
1
136%
.
136%
0%
Total
18
105%
35%
114%
44%
Miscellaneous Statistics for the Samples
BROMOMETHANE
Characteristic
N
%
% Basis
Plotted
18
82%
Spiked
Estimated Values
18
82%
Spiked
Deleted Values
0
0%
Spiked + Not Spiked
Spiked, Censored
4
18%
Spiked
Spiked
22
.
False Negatives
0
0%
0 out of 22
Not Spiked
124
.
False Positives
4
3%
4 out of 124