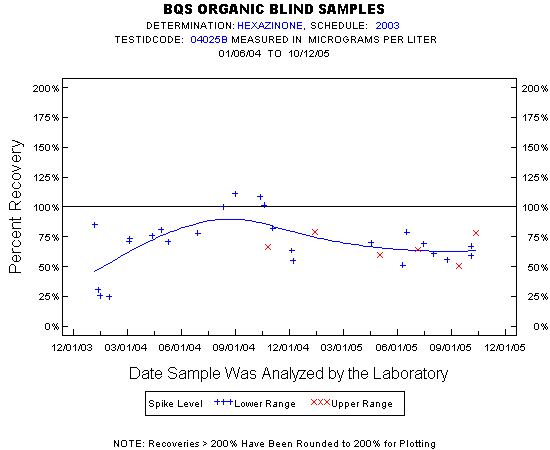
Statistics for the Plotted Points
HEXAZINONE
Spike Level
N
Mean
Std-Dev.
Median
F_Pseudo
Lower Range
25
70%
23%
71%
16%
Upper Range
6
67%
11%
66%
13%
Total
31
69%
21%
70%
15%
Miscellaneous Statistics for the Samples
HEXAZINONE
Characteristic
N
%
% Basis
Plotted
31
100%
Spiked
Estimated Values
1
3%
Spiked
Deleted Values
0
0%
Spiked + Not Spiked
Spiked, Censored
0
0%
Spiked
Spiked
31
.
False Negatives
0
0%
0 out of 31
Not Spiked
22
.
False Positives
0
0%
0 out of 22