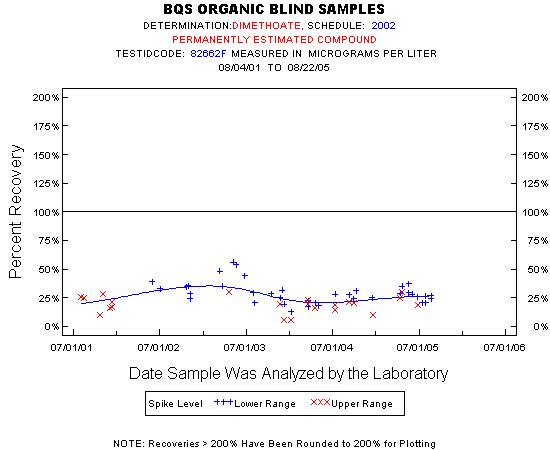
Statistics for the Plotted Points
DIMETHOATE
Spike Level
N
Mean
Std-Dev.
Median
F_Pseudo
Lower Range
38
29%
9%
28%
8%
Upper Range
22
19%
7%
20%
7%
Total
60
26%
10%
25%
8%
Miscellaneous Statistics for the Samples
DIMETHOATE
Characteristic
N
%
% Basis
Plotted
60
98%
Spiked
Estimated Values
60
98%
Spiked
Deleted Values
1
1%
Spiked + Not Spiked
Spiked, Censored
0
0%
Spiked
Spiked
62
.
False Negatives
1
2%
1 out of 61
Not Spiked
40
.
False Positives
0
0%
0 out of 40