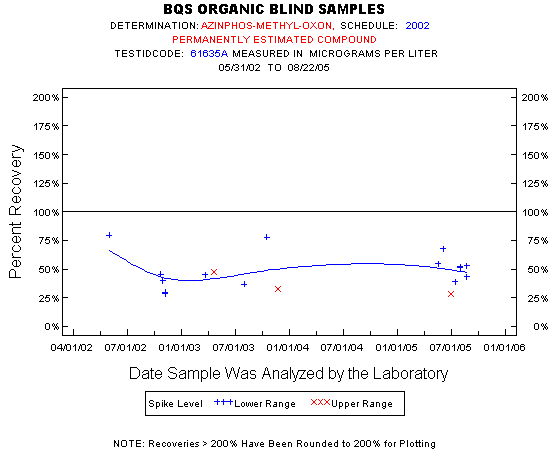
| Statistics for the Plotted Points |
| AZINPHOS-METHYL-OXON |
| Spike Level | N | Mean | Std-Dev. | Median | F_Pseudo |
|---|---|---|---|---|---|
| Lower Range | 15 | 50% | 16% | 46% | 12% |
| Upper Range | 3 | 36% | 10% | 33% | 14% |
| Total | 18 | 47% | 15% | 45% | 12% |
| Miscellaneous Statistics for the Samples |
| AZINPHOS-METHYL-OXON |
| Characteristic | N | % | % Basis |
|---|---|---|---|
| Plotted | 18 | 86% | Spiked |
| Estimated Values | 18 | 86% | Spiked |
| Deleted Values | 1 | 1% | Spiked + Not Spiked |
| Spiked, Censored | 1 | 5% | Spiked |
| Spiked | 21 | . | |
| False Negatives | 2 | 10% | 2 out of 21 |
| Not Spiked | 81 | . | |
| False Positives | 0 | 0% | 0 out of 80 |