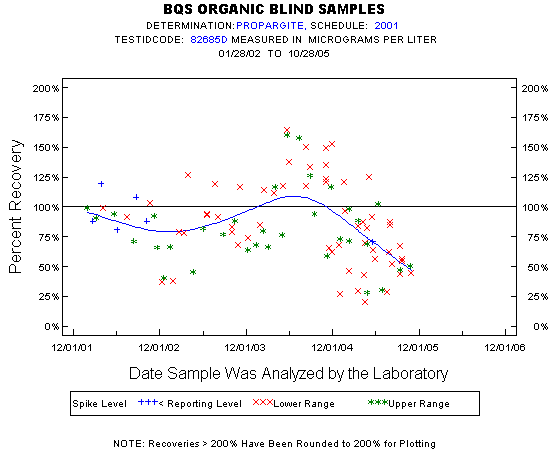
| Statistics for the Plotted Points |
| PROPARGITE |
| Spike Level | N | Mean | Std-Dev. | Median | F_Pseudo |
|---|---|---|---|---|---|
| Lower Range | 59 | 87% | 35% | 85% | 41% |
| Upper Range | 34 | 81% | 31% | 77% | 21% |
| < Reporting Level | 6 | 93% | 18% | 88% | 20% |
| Total | 99 | 85% | 33% | 83% | 33% |
| Miscellaneous Statistics for the Samples |
| PROPARGITE |
| Characteristic | N | % | % Basis |
|---|---|---|---|
| Plotted | 99 | 88% | Spiked |
| Estimated Values | 21 | 19% | Spiked |
| Deleted Values | 0 | 0% | Spiked + Not Spiked |
| Spiked, Censored | 12 | 11% | Spiked |
| Spiked | 113 | . | |
| False Negatives | 2 | 2% | 2 out of 113 |
| Not Spiked | 134 | . | |
| False Positives | 0 | 0% | 0 out of 134 |