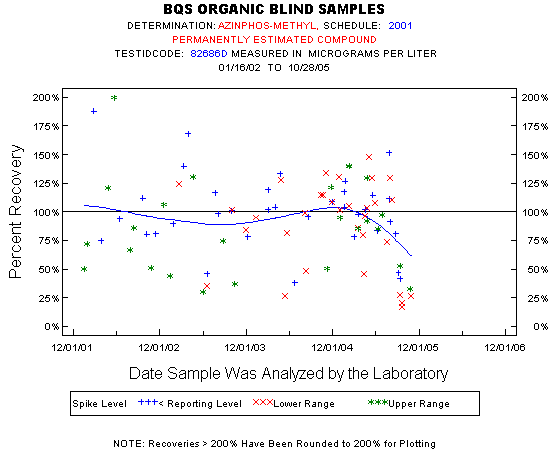
| Statistics for the Plotted Points |
| AZINPHOS-METHYL |
| Spike Level | N | Mean | Std-Dev. | Median | F_Pseudo |
|---|---|---|---|---|---|
| Lower Range | 32 | 89% | 38% | 100% | 40% |
| Upper Range | 25 | 88% | 42% | 86% | 52% |
| < Reporting Level | 35 | 101% | 33% | 101% | 27% |
| Total | 92 | 93% | 37% | 97% | 31% |
| Miscellaneous Statistics for the Samples |
| AZINPHOS-METHYL |
| Characteristic | N | % | % Basis |
|---|---|---|---|
| Plotted | 92 | 84% | Spiked |
| Estimated Values | 92 | 84% | Spiked |
| Deleted Values | 0 | 0% | Spiked + Not Spiked |
| Spiked, Censored | 15 | 14% | Spiked |
| Spiked | 110 | . | |
| False Negatives | 3 | 3% | 3 out of 110 |
| Not Spiked | 137 | . | |
| False Positives | 1 | 1% | 1 out of 137 |