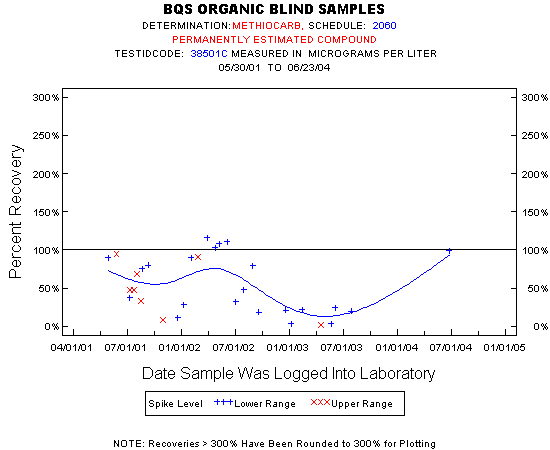
Statistics for the Plotted Points
METHIOCARB
Spike Level
N
Mean
Std-Dev.
Median
F_Pseudo
Lower Range
22
56%
39%
43%
51%
Upper Range
8
49%
34%
47%
43%
Total
30
54%
38%
47%
51%
Miscellaneous Statistics for the Samples
METHIOCARB
Characteristic
N
%
% Basis
Plotted
30
70%
Spiked
Estimated Values
30
70%
Spiked
Deleted Values
0
0%
Spiked + Not Spiked
Spiked, Censored
0
0%
Spiked
Spiked
43
.
False Negatives
13
30%
13 out of 43
Not Spiked
80
.
False Positives
0
0%
0 out of 80