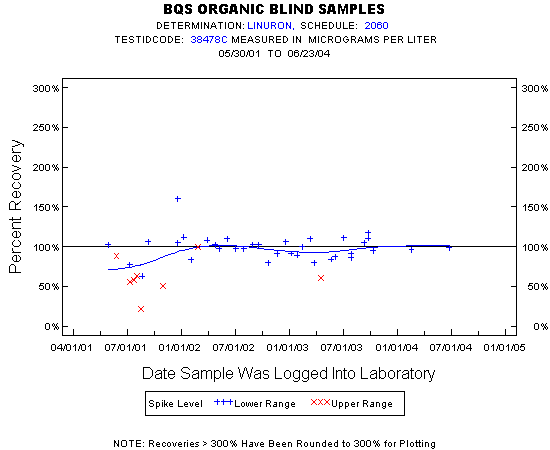
Statistics for the Plotted Points
LINURON
Spike Level
N
Mean
Std-Dev.
Median
F_Pseudo
Lower Range
35
99%
16%
99%
13%
Upper Range
8
63%
24%
60%
17%
Total
43
92%
22%
97%
16%
Miscellaneous Statistics for the Samples
LINURON
Characteristic
N
%
% Basis
Plotted
43
100%
Spiked
Estimated Values
4
9%
Spiked
Deleted Values
0
0%
Spiked + Not Spiked
Spiked, Censored
0
0%
Spiked
Spiked
43
.
False Negatives
0
0%
0 out of 43
Not Spiked
80
.
False Positives
0
0%
0 out of 80