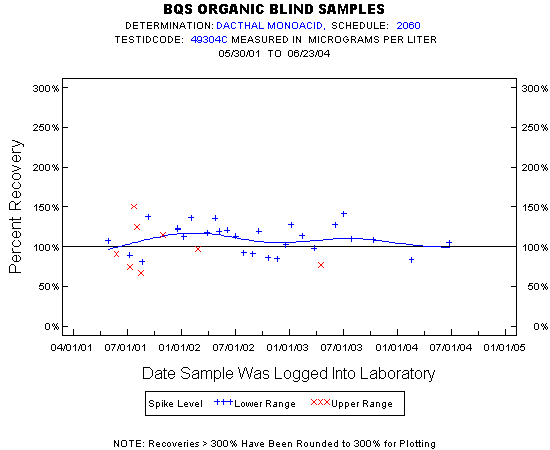
Statistics for the Plotted Points
DACTHAL MONOACID
Spike Level
N
Mean
Std-Dev.
Median
F_Pseudo
Lower Range
28
111%
18%
113%
20%
Upper Range
8
100%
29%
94%
32%
Total
36
109%
21%
111%
23%
Miscellaneous Statistics for the Samples
DACTHAL MONOACID
Characteristic
N
%
% Basis
Plotted
36
100%
Spiked
Estimated Values
0
0%
Spiked
Deleted Values
1
1%
Spiked + Not Spiked
Spiked, Censored
0
0%
Spiked
Spiked
36
.
False Negatives
0
0%
0 out of 36
Not Spiked
87
.
False Positives
0
0%
0 out of 86