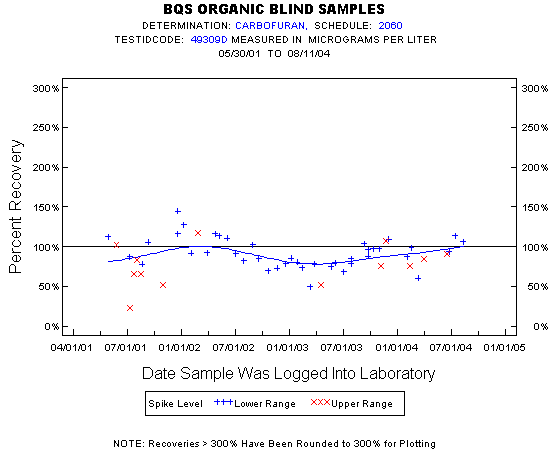
Statistics for the Plotted Points
CARBOFURAN
Spike Level
N
Mean
Std-Dev.
Median
F_Pseudo
Lower Range
41
93%
19%
91%
20%
Upper Range
13
77%
26%
76%
19%
Total
54
89%
21%
88%
20%
Miscellaneous Statistics for the Samples
CARBOFURAN
Characteristic
N
%
% Basis
Plotted
54
100%
Spiked
Estimated Values
1
2%
Spiked
Deleted Values
0
0%
Spiked + Not Spiked
Spiked, Censored
0
0%
Spiked
Spiked
54
.
False Negatives
0
0%
0 out of 54
Not Spiked
69
.
False Positives
0
0%
0 out of 69