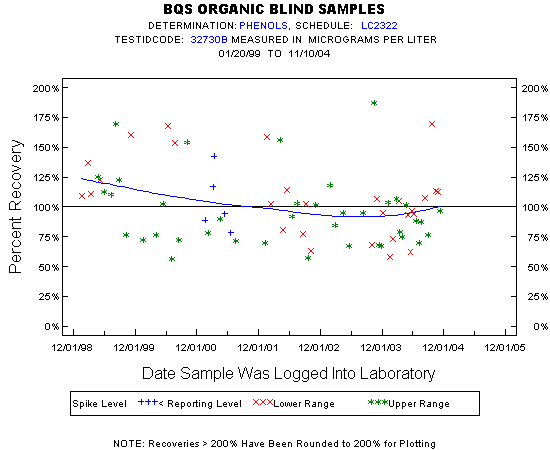
Statistics for the Plotted Points
PHENOLS
Spike Level
N
Mean
Std-Dev.
Median
F_Pseudo
Lower Range
28
108%
32%
106%
24%
Upper Range
39
96%
30%
90%
25%
< Reporting Level
5
104%
26%
94%
21%
Total
72
101%
31%
96%
27%
Miscellaneous Statistics for the Samples
PHENOLS
Characteristic
N
%
% Basis
Plotted
72
95%
Spiked
Estimated Values
12
16%
Spiked
Deleted Values
3
4%
Spiked + Not Spiked
Spiked, Censored
1
1%
Spiked
Spiked
79
.
False Negatives
3
4%
3 out of 76
Not Spiked
0
.
False Positives
0
.
0 out of 0