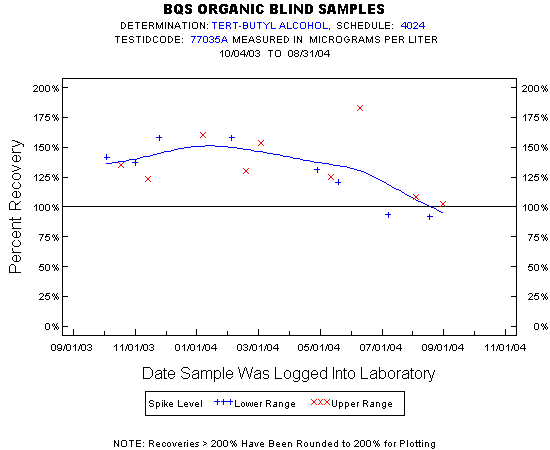
Statistics for the Plotted Points
TERT-BUTYL ALCOHOL
Spike Level
N
Mean
Std-Dev.
Median
F_Pseudo
Lower Range
8
129%
26%
134%
32%
Upper Range
9
136%
26%
130%
23%
Total
17
133%
25%
131%
25%
Miscellaneous Statistics for the Samples
TERT-BUTYL ALCOHOL
Characteristic
N
%
% Basis
Plotted
17
100%
Spiked
Estimated Values
1
6%
Spiked
Deleted Values
0
0%
Spiked + Not Spiked
Spiked, Censored
0
0%
Spiked
Spiked
17
.
False Negatives
0
0%
0 out of 17
Not Spiked
6
.
False Positives
0
0%
0 out of 6