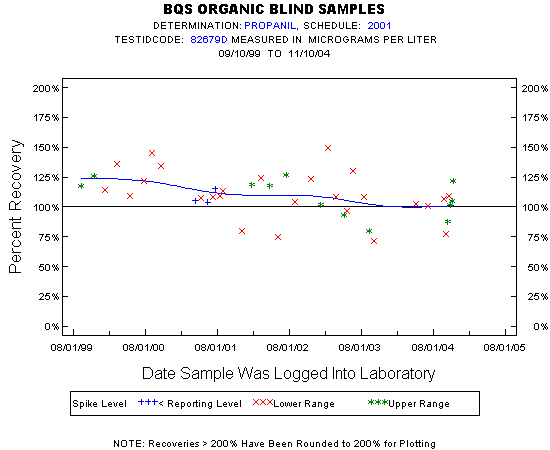
Statistics for the Plotted Points
PROPANIL
Spike Level
N
Mean
Std-Dev.
Median
F_Pseudo
Lower Range
26
110%
20%
109%
16%
Upper Range
12
108%
16%
112%
17%
< Reporting Level
3
108%
6%
106%
8%
Total
41
110%
18%
109%
15%
Miscellaneous Statistics for the Samples
PROPANIL
Characteristic
N
%
% Basis
Plotted
41
100%
Spiked
Estimated Values
0
0%
Spiked
Deleted Values
3
1%
Spiked + Not Spiked
Spiked, Censored
0
0%
Spiked
Spiked
43
.
False Negatives
0
0%
0 out of 41
Not Spiked
243
.
False Positives
1
0%
1 out of 242