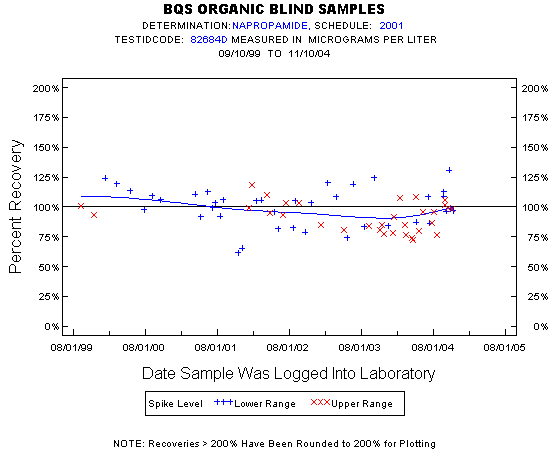
Statistics for the Plotted Points
NAPROPAMIDE
Spike Level
N
Mean
Std-Dev.
Median
F_Pseudo
Lower Range
39
100%
16%
103%
17%
Upper Range
32
92%
12%
93%
15%
Total
71
97%
15%
98%
17%
Miscellaneous Statistics for the Samples
NAPROPAMIDE
Characteristic
N
%
% Basis
Plotted
71
100%
Spiked
Estimated Values
0
0%
Spiked
Deleted Values
3
1%
Spiked + Not Spiked
Spiked, Censored
0
0%
Spiked
Spiked
73
.
False Negatives
0
0%
0 out of 71
Not Spiked
213
.
False Positives
0
0%
0 out of 212