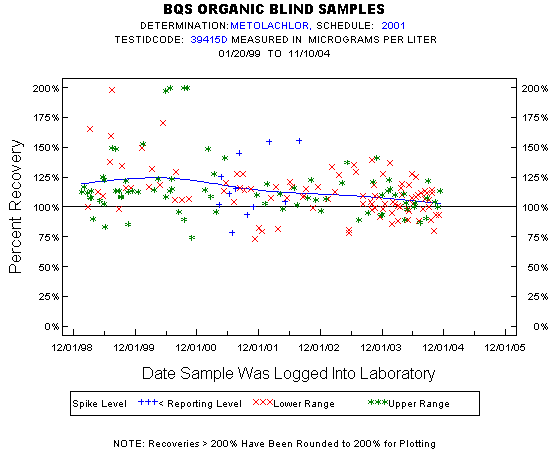
| Statistics for the Plotted Points |
| METOLACHLOR |
| Spike Level | N | Mean | Std-Dev. | Median | F_Pseudo |
|---|---|---|---|---|---|
| Lower Range | 99 | 112% | 20% | 109% | 14% |
| Upper Range | 81 | 115% | 25% | 111% | 14% |
| < Reporting Level | 11 | 117% | 26% | 111% | 33% |
| Total | 191 | 113% | 22% | 110% | 15% |
| Miscellaneous Statistics for the Samples |
| METOLACHLOR |
| Characteristic | N | % | % Basis |
|---|---|---|---|
| Plotted | 191 | 100% | Spiked |
| Estimated Values | 20 | 10% | Spiked |
| Deleted Values | 11 | 4% | Spiked + Not Spiked |
| Spiked, Censored | 0 | 0% | Spiked |
| Spiked | 202 | . | |
| False Negatives | 0 | 0% | 0 out of 191 |
| Not Spiked | 84 | . | |
| False Positives | 4 | 5% | 4 out of 84 |