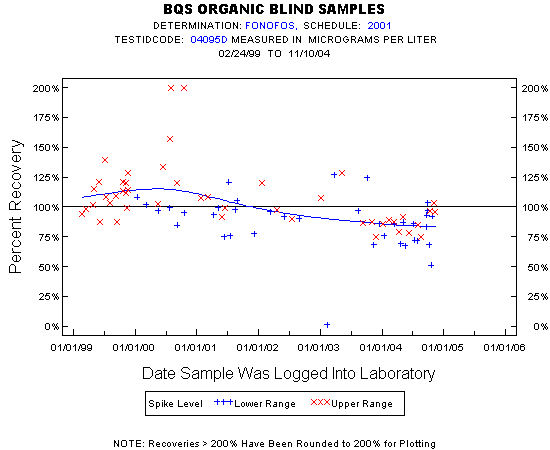
Statistics for the Plotted Points
FONOFOS
Spike Level
N
Mean
Std-Dev.
Median
F_Pseudo
Lower Range
38
87%
22%
91%
16%
Upper Range
47
108%
26%
102%
23%
Total
85
99%
26%
96%
16%
Miscellaneous Statistics for the Samples
FONOFOS
Characteristic
N
%
% Basis
Plotted
85
97%
Spiked
Estimated Values
3
3%
Spiked
Deleted Values
3
1%
Spiked + Not Spiked
Spiked, Censored
0
0%
Spiked
Spiked
90
.
False Negatives
3
3%
3 out of 88
Not Spiked
196
.
False Positives
1
1%
1 out of 195