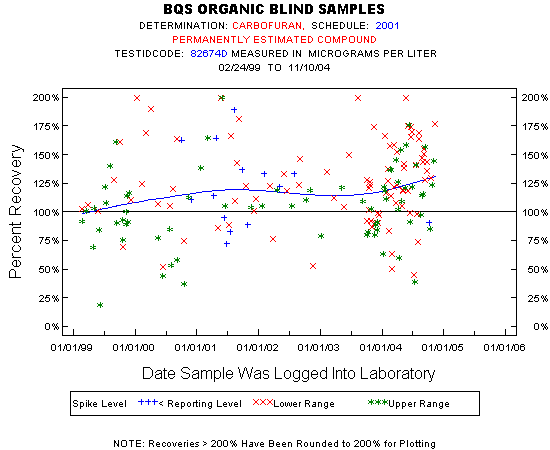
| Statistics for the Plotted Points |
| CARBOFURAN |
| Spike Level | N | Mean | Std-Dev. | Median | F_Pseudo |
|---|---|---|---|---|---|
| Lower Range | 93 | 126% | 36% | 123% | 37% |
| Upper Range | 72 | 105% | 33% | 105% | 28% |
| < Reporting Level | 14 | 121% | 34% | 118% | 34% |
| Total | 179 | 117% | 36% | 116% | 37% |
| Miscellaneous Statistics for the Samples |
| CARBOFURAN |
| Characteristic | N | % | % Basis |
|---|---|---|---|
| Plotted | 179 | 99% | Spiked |
| Estimated Values | 179 | 99% | Spiked |
| Deleted Values | 3 | 1% | Spiked + Not Spiked |
| Spiked, Censored | 0 | 0% | Spiked |
| Spiked | 182 | . | |
| False Negatives | 2 | 1% | 2 out of 181 |
| Not Spiked | 104 | . | |
| False Positives | 1 | 1% | 1 out of 102 |