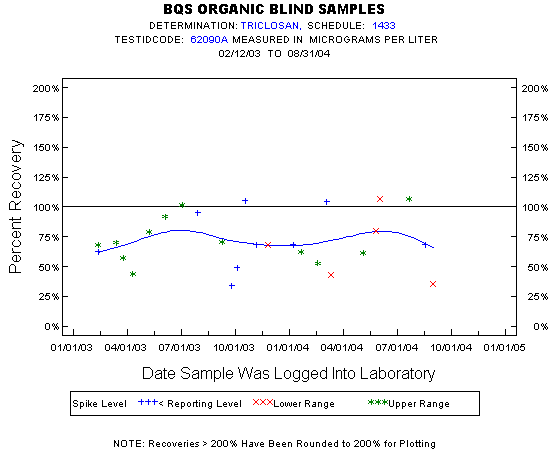
Statistics for the Plotted Points
TRICLOSAN
Spike Level
N
Mean
Std-Dev.
Median
F_Pseudo
Lower Range
5
67%
29%
68%
27%
Upper Range
12
72%
19%
69%
19%
< Reporting Level
9
73%
24%
68%
24%
Total
26
72%
22%
68%
26%
Miscellaneous Statistics for the Samples
TRICLOSAN
Characteristic
N
%
% Basis
Plotted
26
100%
Spiked
Estimated Values
12
46%
Spiked
Deleted Values
2
3%
Spiked + Not Spiked
Spiked, Censored
0
0%
Spiked
Spiked
26
.
False Negatives
0
0%
0 out of 26
Not Spiked
51
.
False Positives
0
0%
0 out of 49