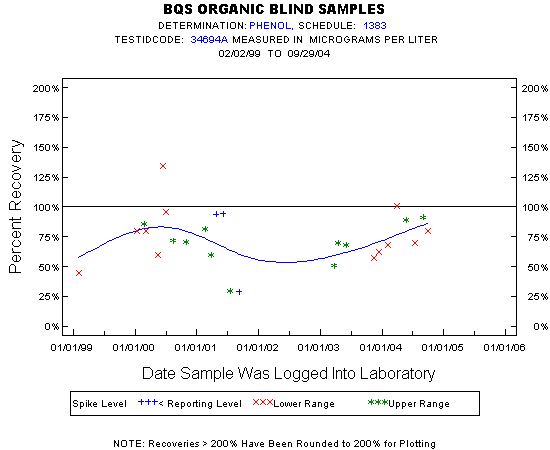
Statistics for the Plotted Points
PHENOL
Spike Level
N
Mean
Std-Dev.
Median
F_Pseudo
Lower Range
12
78%
24%
75%
20%
Upper Range
11
70%
18%
71%
19%
< Reporting Level
3
72%
38%
94%
49%
Total
26
74%
23%
71%
22%
Miscellaneous Statistics for the Samples
PHENOL
Characteristic
N
%
% Basis
Plotted
26
90%
Spiked
Estimated Values
10
34%
Spiked
Deleted Values
2
3%
Spiked + Not Spiked
Spiked, Censored
1
3%
Spiked
Spiked
31
.
False Negatives
2
7%
2 out of 29
Not Spiked
27
.
False Positives
3
11%
3 out of 27