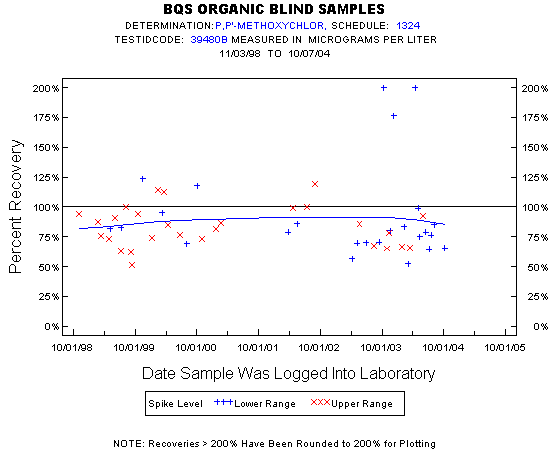
Statistics for the Plotted Points
P,P'-METHOXYCHLOR
Spike Level
N
Mean
Std-Dev.
Median
F_Pseudo
Lower Range
25
94%
41%
80%
19%
Upper Range
28
84%
17%
83%
18%
Total
53
88%
31%
82%
18%
Miscellaneous Statistics for the Samples
P,P'-METHOXYCHLOR
Characteristic
N
%
% Basis
Plotted
53
98%
Spiked
Estimated Values
4
7%
Spiked
Deleted Values
2
3%
Spiked + Not Spiked
Spiked, Censored
0
0%
Spiked
Spiked
56
.
False Negatives
1
2%
1 out of 54
Not Spiked
17
.
False Positives
1
6%
1 out of 17