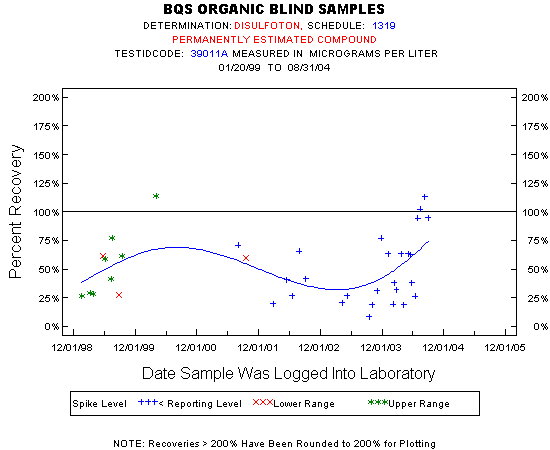
Statistics for the Plotted Points
DISULFOTON
Spike Level
N
Mean
Std-Dev.
Median
F_Pseudo
Lower Range
3
50%
19%
60%
26%
Upper Range
8
55%
30%
50%
30%
< Reporting Level
26
49%
30%
40%
29%
Total
37
50%
29%
41%
27%
Miscellaneous Statistics for the Samples
DISULFOTON
Characteristic
N
%
% Basis
Plotted
37
77%
Spiked
Estimated Values
33
69%
Spiked
Deleted Values
13
18%
Spiked + Not Spiked
Spiked, Censored
8
17%
Spiked
Spiked
52
.
False Negatives
3
6%
3 out of 48
Not Spiked
22
.
False Positives
0
0%
0 out of 13