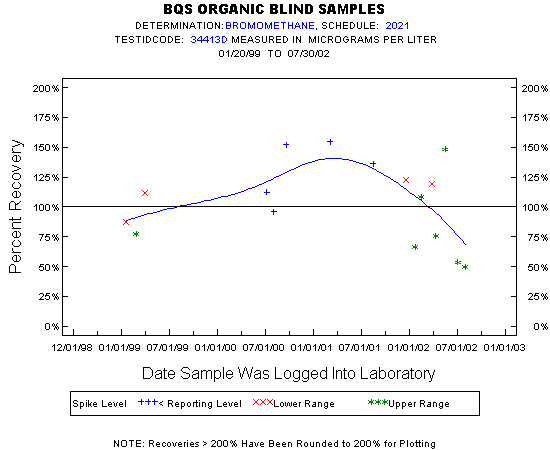
| Statistics for the Plotted Points |
| BROMOMETHANE |
| Spike Level | N | Mean | Std-Dev. | Median | F_Pseudo |
|---|---|---|---|---|---|
| Lower Range | 4 | 110% | 16% | 116% | 16% |
| Upper Range | 7 | 83% | 35% | 76% | 41% |
| < Reporting Level | 5 | 130% | 26% | 136% | 30% |
| Total | 16 | 105% | 34% | 110% | 39% |
| Miscellaneous Statistics for the Samples |
| BROMOMETHANE |
| Characteristic | N | % | % Basis |
|---|---|---|---|
| Plotted | 16 | 57% | Spiked |
| Estimated Values | 16 | 57% | Spiked |
| Deleted Values | 0 | 0% | Spiked + Not Spiked |
| Spiked, Censored | 12 | 43% | Spiked |
| Spiked | 28 | . | |
| False Negatives | 0 | 0% | 0 out of 28 |
| Not Spiked | 134 | . | |
| False Positives | 6 | 4% | 6 out of 134 |