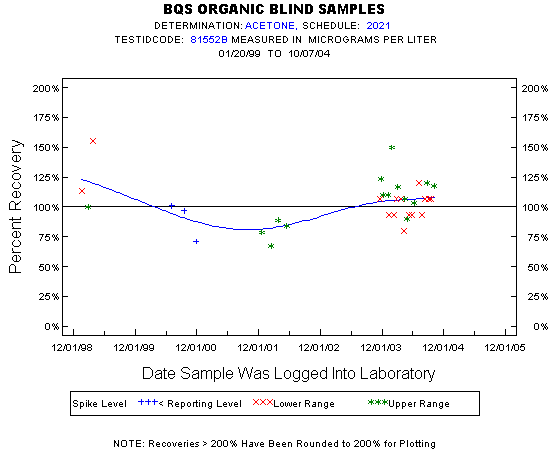
Statistics for the Plotted Points
ACETONE
Spike Level
N
Mean
Std-Dev.
Median
F_Pseudo
Lower Range
15
105%
17%
107%
10%
Upper Range
15
104%
21%
107%
21%
< Reporting Level
3
90%
16%
97%
22%
Total
33
103%
19%
107%
12%
Miscellaneous Statistics for the Samples
ACETONE
Characteristic
N
%
% Basis
Plotted
33
73%
Spiked
Estimated Values
4
9%
Spiked
Deleted Values
0
0%
Spiked + Not Spiked
Spiked, Censored
12
27%
Spiked
Spiked
45
.
False Negatives
0
0%
0 out of 45
Not Spiked
117
.
False Positives
2
2%
2 out of 117