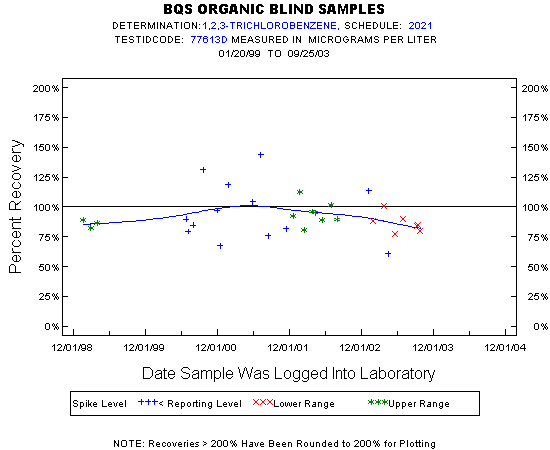
| Statistics for the Plotted Points |
| 1,2,3-TRICHLOROBENZENE |
| Spike Level | N | Mean | Std-Dev. | Median | F_Pseudo |
|---|---|---|---|---|---|
| Lower Range | 7 | 87% | 8% | 85% | 8% |
| Upper Range | 11 | 92% | 9% | 90% | 7% |
| < Reporting Level | 13 | 96% | 25% | 90% | 25% |
| Total | 31 | 93% | 17% | 89% | 14% |
| Miscellaneous Statistics for the Samples |
| 1,2,3-TRICHLOROBENZENE |
| Characteristic | N | % | % Basis |
|---|---|---|---|
| Plotted | 31 | 82% | Spiked |
| Estimated Values | 16 | 42% | Spiked |
| Deleted Values | 0 | 0% | Spiked + Not Spiked |
| Spiked, Censored | 7 | 18% | Spiked |
| Spiked | 38 | . | |
| False Negatives | 0 | 0% | 0 out of 38 |
| Not Spiked | 124 | . | |
| False Positives | 0 | 0% | 0 out of 124 |